Data Visualization Tools for Your Business in 2023
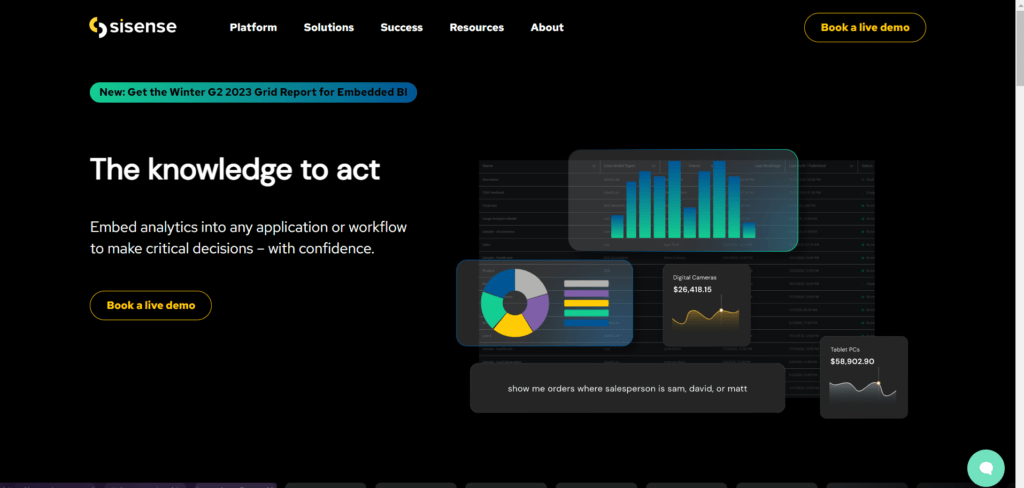
Top 7 Data Visualization Tools for Your Business in 2023 As we enter a new year, businesses are looking for new and innovative ways to understand and analyze their data. One of the best ways to do this is through data visualization, which allows you to turn complex data into easy-to-understand visuals. In this article, we will look at the top 7 data visualization tools for your business in 2023. What is Data Visualization? Data visualization is a method of presenting data in a visual format such as charts, graphs, and maps. Data visualization tools help to make complex data more understandable and digestible. By using these tools, businesses can easily identify trends and patterns, as well as spot outliers that would be difficult to identify in raw data. Data visualization is essential in making informed decisions based on data-driven insights. What are Data Visualization Tools? Data visualization tools are software applications that allow you to create visual representations of your data. These tools take raw data and turn it into charts, graphs, and other visualizations that help businesses understand their data and make informed decisions. There are many data visualization tools available, each with its own strengths and weaknesses. The 7 Best Data Visualization Tools of 2023 Our favorite tools for data visualization in 2023 are: Tableau – Best for interactive graphs Infogram – Best for linking real-time data Qlikview – Best for ease of use ChartBlock -Best for importing data from multiple sources Datawrapper – Best for personalized data sets Google Charts -Best for compatibility with Google products Sisense – Best for customer support 1. Tableau Tableau is one of the most popular data visualization tools available. It allows businesses to connect to a variety of data sources and create interactive visualizations using a drag-and-drop interface. Tableau is particularly useful for large datasets and has a variety of features for advanced data analysis. It is a popular data visualization tool that is widely used in the business intelligence industry. It allows users to create interactive dashboards and reports from various data sources. Here are some of the pros and cons of using Tableau: Pros: User-friendly interface Interactive visualization Connects to various data sources Real-time data analysis Customizable dashboards Cons: Expensive Steep learning curve Limited data transformation Security concerns Lack of customizations 2. Infogram Infogram is a data visualization tool that focuses on creating infographics and interactive charts. It has a user-friendly interface that allows businesses to quickly create visualizations using pre-made templates. Infogram is particularly useful for businesses that want to create visually appealing reports or presentations. Here are some of the pros and cons of using Infogram: Pros: User-friendly interface Large template library Integration with other tools Affordable pricing Time-saving Cons: Limited customization options Steep learning curve Limited data import options Limited customer support Limited branding options 3. Qlikview Qlikview is a data visualization tool that allows businesses to create interactive dashboards and visualizations. It has a variety of features for advanced data analysis, including data integration and data modeling. Qlikview is particularly useful for businesses that need to analyze large datasets and create custom visualizations. Pros: Advanced data analysis capabilities Flexible data visualization options Strong security features Easy data integration Customizable dashboards Cons: Steep learning curve Expensive licensing fees Limited mobile functionality Limited collaboration features Resource-intensive data processing 4.ChartBlocks ChartBlocks is a data visualization tool that allows businesses to create charts and graphs using a drag-and-drop interface. It has a variety of chart types and customization options, making it useful for businesses that need to create a variety of visualizations. ChartBlocks is also affordable, making it a good option for small businesses. Pros: Easy-to-use interface Customizable chart designs Can import data from various sources Offers a variety of chart types Affordable pricing options Cons: Limited customization options for some chart types Data importing can sometimes be buggy No option to save charts as templates No collaboration features Limited customer support options 5. Datawrapper Datawrapper is a data visualization tool that allows businesses to create interactive charts and maps. It has a user-friendly interface and is particularly useful for businesses that need to create visualizations for online publications. Datawrapper also has a variety of customization options, making it easy to create visually appealing visualizations. Pros: Easy-to-use interface Wide range of chart types Customizable design options Real-time collaboration with team members Responsive and interactive charts Cons: Limited free plan options Limited data visualization options Limited customization options for free plan No ability to upload custom fonts Limited integration with third-party tools 6. Google Charts Google Charts is a data visualization tool that allows businesses to create a variety of charts and graphs using Google’s chart library. It is easy to use and has a variety of customization options, making it useful for businesses that need to quickly create visualizations. Google Charts is also free, making it a good option for small businesses. Pros: Wide range of chart types and customization options. Free to use and integrate with other Google products. Scalable and can handle large datasets. Real-time data visualization capabilities. Easy to embed charts on websites or in other applications. Cons: Requires a Google account to use. Limited offline access to charts. Limited branding options. Limited customer support. Can be challenging for users who are not familiar with Google products or data visualization principles. 7. Sisense Sisense is a data visualization tool that allows businesses to create interactive dashboards and visualizations. It has a variety of features for advanced data analysis, including data integration and data modeling. Sisense is particularly useful for businesses that need to analyze large datasets and create custom visualizations. Pros: Sisense offers a user-friendly interface that allows for easy data visualization and analysis. The tool is highly customizable and allows for integration with various third-party tools and platforms. Sisense provides real-time data processing and enables quick generation of reports and dashboards. The platform is cloud-based, which allows for easy scalability and accessibility from any device. Sisense offers a robust security framework to ensure
Data Visualization Tools for Your Business in 2023 Read More »


